Mortgage rate curve: definition
In the Swiss mortgage market, the rate curve graphically shows mortgage interest rates by term (1, 3, 5, 10 years, etc.).
Each point on the rate curve corresponds to the average rate for a given mortgage type (often fixed-rate) for a specific maturity. Switzerland’s mortgage rate curve reflects market expectations for short-term rates (SARON, the SNB policy rate) and long-term rates (swaps, Swiss Confederation bonds), as well as banks’ margins.
A « normal » curve is upward-sloping: the longer the term, the higher the rate, because the bank commits for longer and requires a risk premium. When the curve is flat or inverted (long-term rates close to or below short-term rates), it often signals expectations of future policy-rate cuts or heightened economic uncertainty. Understanding the rate curve helps you choose between a fixed-rate mortgage, a SARON mortgage, or a mixed strategy.
Technical concept of Switzerland’s mortgage rate curve
Technically, the mortgage rate curve is built from several components:
Short-term rates (SARON, SNB policy rate)
- SARON (Swiss Average Rate Overnight) is the reference rate for the CHF money market over very short terms.
- The SNB sets a policy rate that directly influences SARON and therefore the cost of SARON mortgages.
- SARON mortgages billed to clients are generally « SARON + the bank’s margin ».
Long-term rates (CHF swaps, Swiss Confederation bonds)
- Fixed mortgage rates over 5, 10 or 15 years are strongly correlated with swap rates and government bond yields of the same maturity.
- When 10-year bond yields rise, the long end of the mortgage rate curve tends to steepen; when they fall, long-term fixed rates decline.
The bank’s margin and credit risk
- Starting from the « pure » risk-free curve (SARON + swaps), the bank adds a commercial margin that reflects its funding cost, borrower risk, regulatory requirements (e.g., Basel III) and competition.
- This results in the mortgage rate curve actually offered to retail borrowers (fixed rates, SARON mortgages, mixed solutions).
In practice, the mortgage rate curve is read as follows:
- Upward-sloping curve (10-year > 5-year > SARON)
→ the market is pricing in higher rates or some uncertainty over the longer term.
→ you pay a term premium to lock in a long fixed rate. - Flat curve (5-year ≈ 10-year)
→ expectations are relatively neutral; the market hesitates between rising and falling scenarios.
→ this can encourage mixed strategies (combining several terms) to smooth risk. - Inverted curve (long-term rates < short-term rates / SARON)
→ the market expects rate cuts over the medium/long term.
→ staying partly in SARON can become attractive again, if your risk tolerance allows it.
For an investor or an owner-occupier, the rate curve is therefore a steering tool: it helps compare the relative cost of a long fixed rate, SARON or a mixed structure, and align the mortgage term with your holding horizon, risk tolerance and view on where rates are heading.
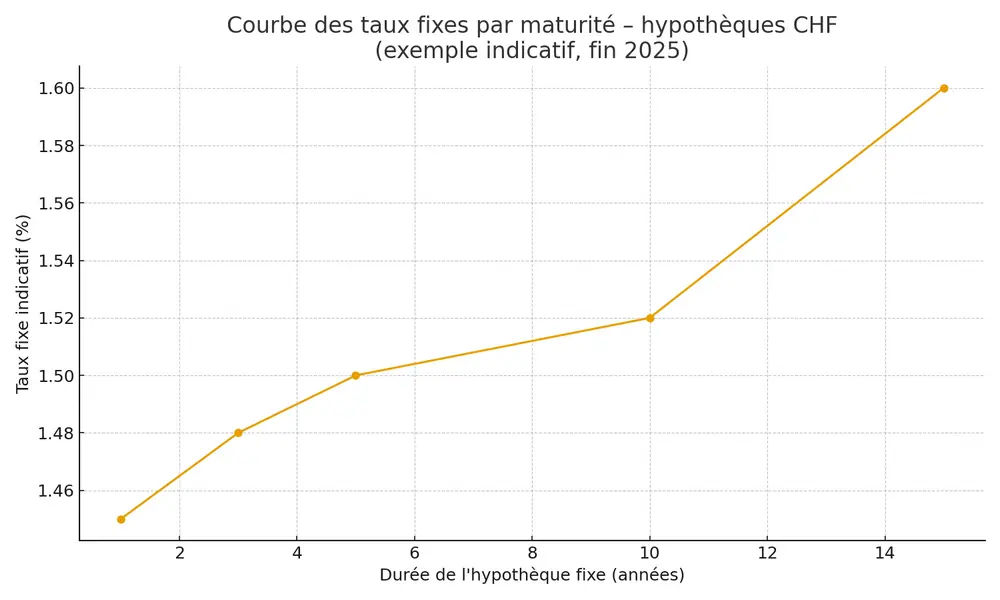
This chart illustrates the mortgage rate curve of Swiss mortgage rates: for each fixed mortgage term (1, 3, 5, 10 and 15 years), it shows the corresponding indicative rate level. The slope of the curve makes it easy to see whether long-term rates are significantly higher than short-term rates.
Choosing a strategy based on the rate curve
A couple wants to lock in a CHF 800,000 mortgage in 2025. They consult Switzerland’s mortgage rate curve (indicative levels):
- SARON mortgage: approx. 1.7% (average SARON slightly positive + bank margin).
- 5-year fixed mortgage: approx. 1.5–1.6%
- 10-year fixed mortgage: approx. 1.5% (a fairly flat 5–10 year segment, depending on comparison sites).
The rate curve is almost horizontal between 5 and 10 years: long-term rates are only slightly higher (or similar) to medium/short-term rates. The couple chooses:
- CHF 400,000 in 10-year fixed, to secure part of the debt over the long term;
- CHF 200,000 in 5-year fixed, to keep a mid-term refinancing opportunity;
- CHF 200,000 in a SARON mortgage, to benefit from flexibility if rates fall further.
By reading the rate curve this way, they build a balanced financing structure: a highly secured portion, a « flexible » mid-term portion, and a SARON-linked tranche that remains adjustable.
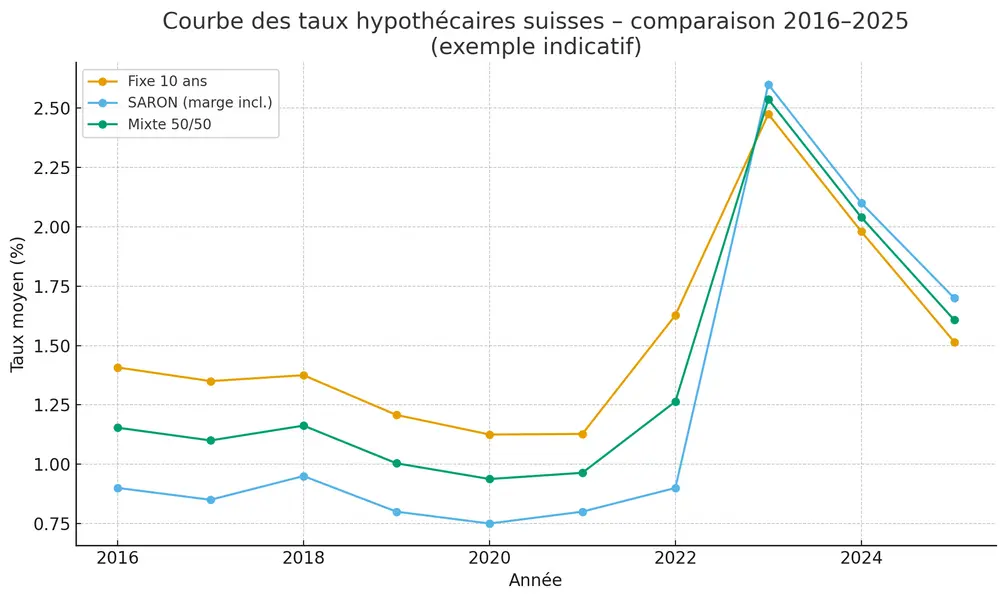
Indicative table illustrating the rate curve over the last 10 years
| Year | 10-year fixed rate (%) | SARON mortgage (%) | 50/50 mixed strategy (%) |
|---|---|---|---|
| 2016 | 1,41 | 0,90 | 1,15 |
| 2017 | 1,35 | 0,85 | 1,10 |
| 2018 | 1,38 | 0,95 | 1,16 |
| 2019 | 1,21 | 0,80 | 1,00 |
| 2020 | 1,13 | 0,75 | 0,94 |
| 2021 | 1,13 | 0,80 | 0,96 |
| 2022 | 1,63 | 0,90 | 1,26 |
| 2023 | 2,48 | 2,60 | 2,54 |
| 2024 | 1,98 | 2,10 | 2,04 |
| 2025* | 1,52 | 1,70 | 1,61 |
*2025 : partial average based on data already available (indicative values)